
Analytics
Usage, cost and earnings for every agent in your organization.
Org → Analytics shows what your agents are actually doing: who uses them, what they cost to run, and what they earn. It needs a paid organization plan.
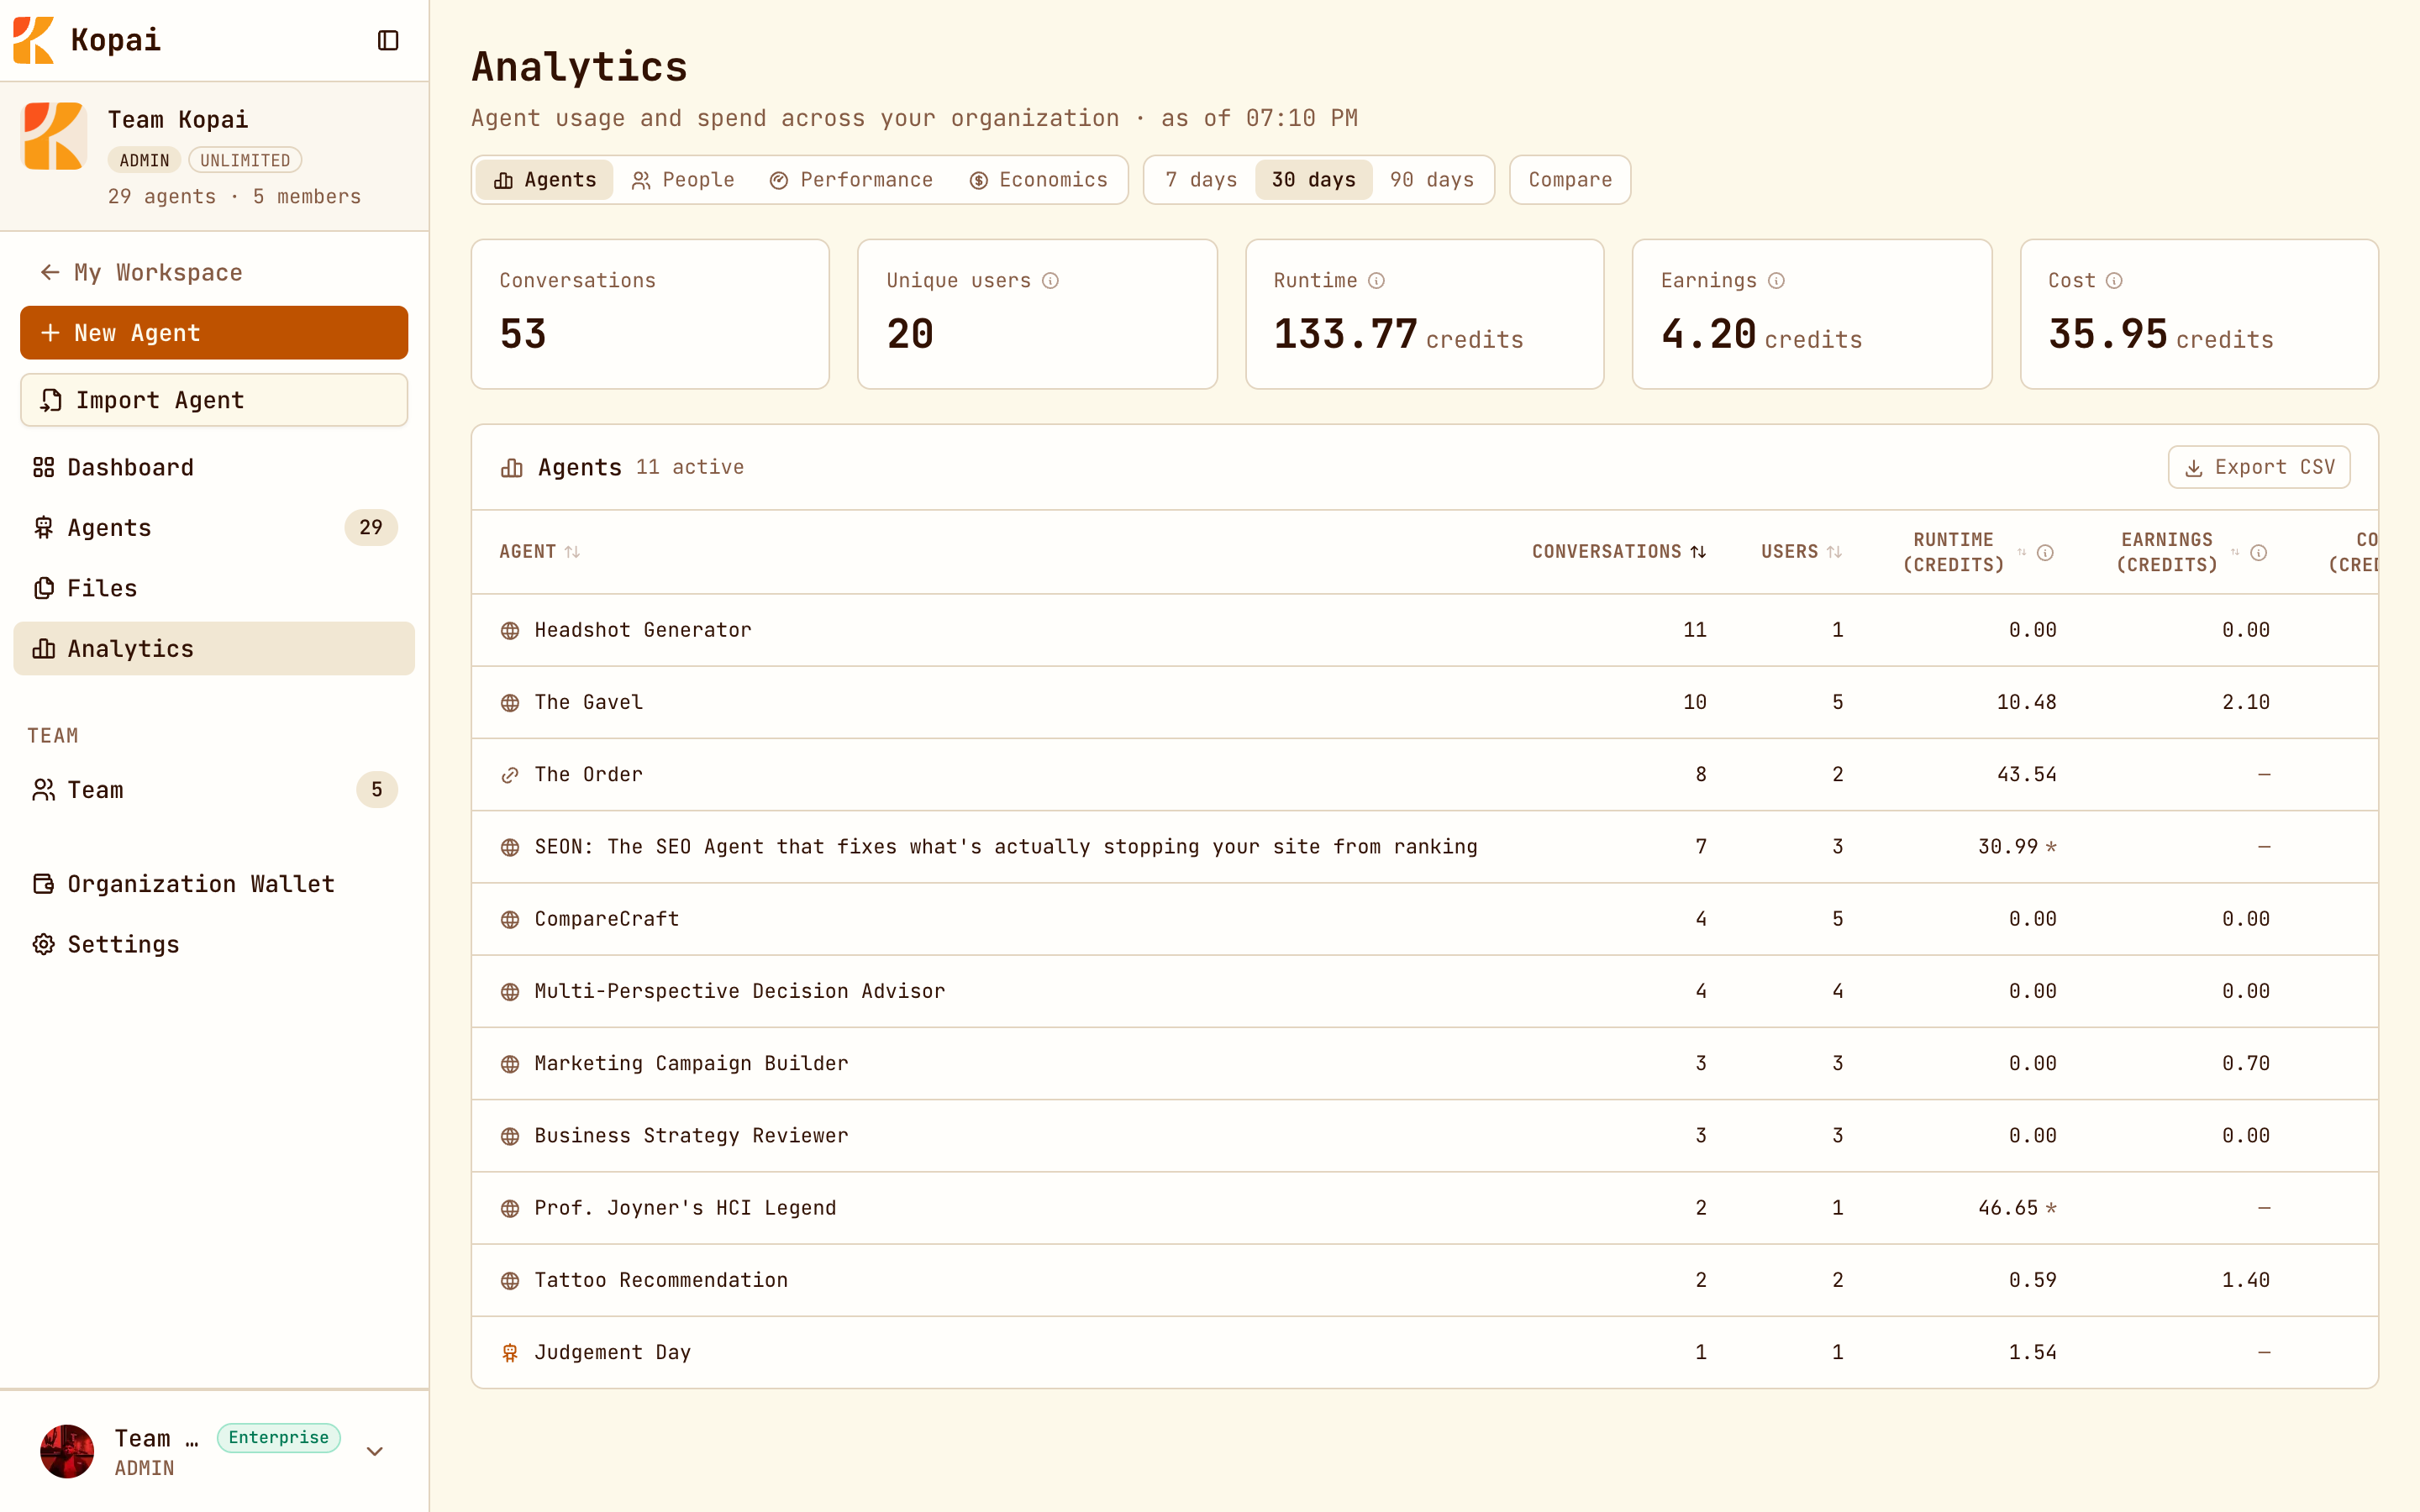
The headline numbers
For the window you pick (7, 30 or 90 days, with an option to compare periods):
| Conversations | How many were started. |
| Unique users | How many different people. |
| Runtime | Credits used running your agents. |
| Earnings | Credits earned from publisher add-ons. |
| Cost | What those runs cost you. |
The views
| Tab | What it answers |
|---|---|
| Agents | Which agents get used, by how many people, at what cost and for what return. |
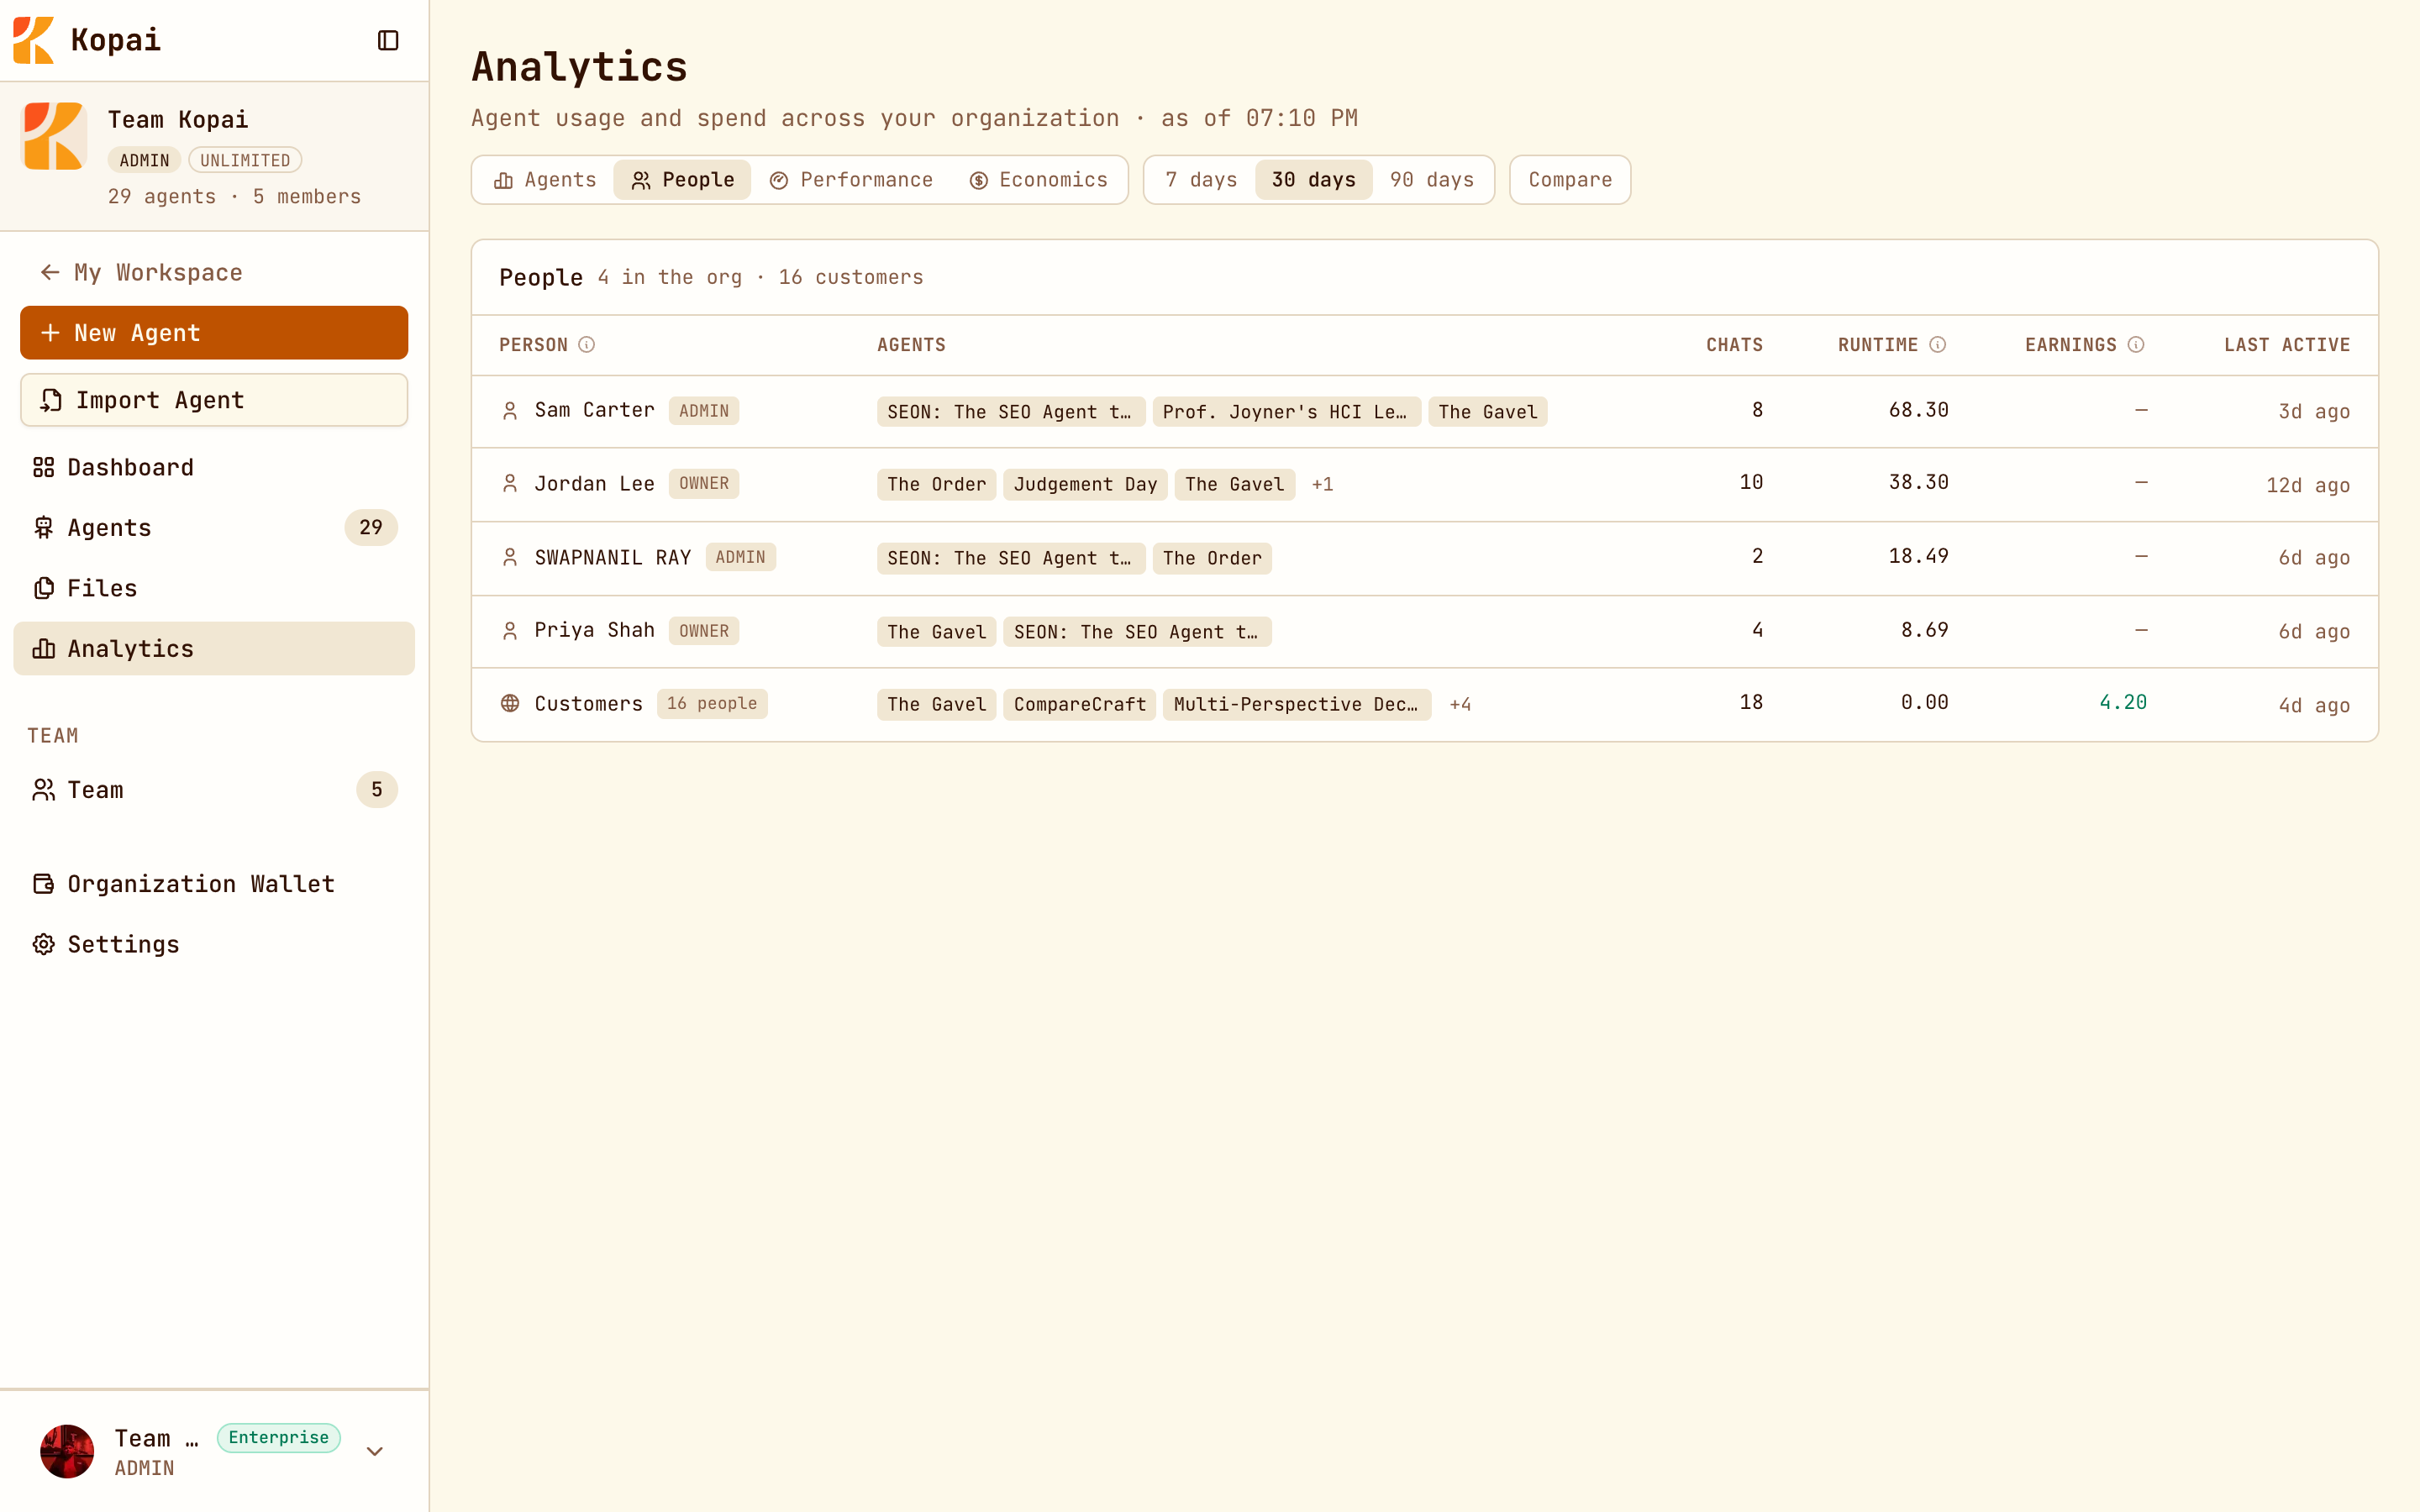
| People | Who's using them, and how often. |
| Performance | How the agents are behaving over time. |
| Economics | Where the credits go and where they come back from. |
The agents table is where most people spend their time: conversations, users, runtime, earnings and cost for each agent, sortable. Export CSV takes it into a spreadsheet.
Reading it honestly
- Runtime and earnings measure the same conversations from two sides. An agent with high runtime and no earnings is one you're paying for. That's fine for an internal agent, and worth a look for a public one with no add-on.
- Conversations with no repeat users usually means people tried it once. That's a problem with the instructions or the scope, not with marketing.
- Watch cost per conversation after changing models. It's the quickest way to notice you upgraded a model and quadrupled the bill.
Who sees what
| Role | Access |
|---|---|
| Owner, Admin | Everything, including cost. |
| Developer | Usage figures, with cost hidden. |
| User | No access. |